Risky Buybacks
Turn and face the strange
Ch-ch-changes - David Bowie
We’ve always found it strange that stock buybacks were typically touted as always good news (a positive catalyst for the stock price) by analysts (it would drive us crazy hearing it over and over again on the morning call) and some investors. The press would get in on the act as well, how many times have you read an article that says buybacks reduce the share count, which boosts earnings per share and the stock price (if only it were that easy)?
Now buybacks are a dirty word. Wonder if at some point in the future we’ll look back at this point in time as when more people started to see stock buybacks in a different light, or whether it’ll be business as usual (companies buying back more and more stock as stock prices rise)?
If corporate and investor behaviors do change, we see it happening in two ways:
- Thinking carefully about whether a buyback is good or bad from the perspective of the remaining shareholders. That depends upon whether the company paid less than intrinsic value (it made a good investment) or more than intrinsic value (it made a bad investment) for the repurchased shares (not a new concept, Warren Buffett has been talking about it for years). Not whether the buyback boosts EPS. You’d also need to consider what it cost to finance the repurchase, the company’s balance sheet (does it have the liquidity/resources to part with the cash?) and what other investment opportunities were available (e.g., if it could generate better returns elsewhere, that’s where it should put its capital to work even if it doesn’t provide a short-term EPS boost).
- Factoring in other stakeholders. In uncertain times, even those that regularly tout buybacks understand the need to put them on hold to preserve cash. How about when things get back to normal? Will companies/investors consider what the dollars spent on buybacks mean to other stakeholders, including their communities, creditors, customers, environment, workers, the government (besides the prohibition on buybacks for companies getting assistance through the CARES Act)? (Check out JUST Capital’s Corporate Response Tracker to see how companies are treating stakeholders amid the crisis).
In this, the second in our series on buybacks, (see our August 5, 2019 piece, Shining A Light on the Blackout Period and Buybacks), we set out to accomplish two things:
- Have a look at where buybacks may be more/less at risk in the current environment and
- Show some summary stats on buybacks over the past 10-13 years to help put things in perspective.
In Search of Risky Buybacks with the Red Flag Finder (RFF)
With all the uncertainty swirling around buybacks today, we grabbed our handy dandy Red Flag Finder (RFF), (see our April 3, 2020 piece RFF #2: The Double L (Leverage and Liquidity), for more info) and focused on three factors to highlight those companies where buybacks may be most/least at risk:
- Buybacks – Compares amount spent on repurchases to free cash flow, used to assess sustainability of the buyback based on whether a company generates enough cash to cover them or not.
- Cash Cushion – Estimates how long a company can pay its near-term contractual obligations with cash on hand; calculated by comparing unrestricted cash to contractual obligations (both on- and off-balance-sheet) due in one year.
- Leverage – Compares net debt (includes leases) to EBITDAR, one way of measuring a company’s ability to meet its on-balance-sheet liabilities. Highly levered companies are generally viewed as higher risk.
 To find the companies with buybacks that may be most and least at risk, we ran the RFF for the S&P 500 (ex-financials, real estate). There were 32 companies that scored a nine or ten (the worst score) on the buybacks factor and on at least one of the other two factors. On the other end of the spectrum, there were 30 companies that scored a two or one (the best score) on the buybacks factor and on at least one of the remaining factors.
In Exhibit 1 we concentrate on companies that spent at least $100 million buying back their stock and list the five companies with the highest (that’s bad) average scores on these three factors indicating their buybacks are most at risk and the five companies scoring the lowest (that’s good) their buybacks may be least at risk.
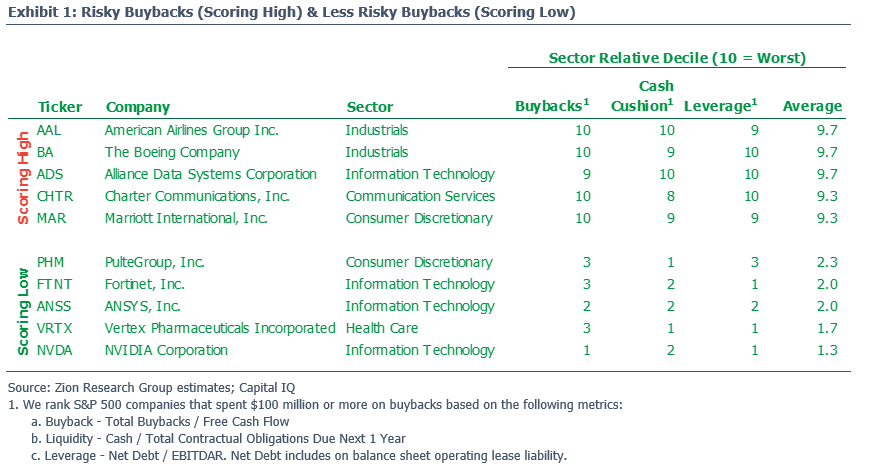
 Note that American Airlines, Boeing and Marriott all recently suspended their buyback programs. Maybe you could use these factors to get in front of companies announcing they are holding off on buybacks (happy to send over a longer list of names that may be at risk). On the other hand, Charter announced on March 4th that it had priced $2.5 billion of senior unsecured notes and among the list of intended use of proceeds, was potential stock buybacks (of course a lot has changed in the past month).
Please reach out if you’re interested in taking a closer look at any of the names and/or want us to run the RFF on the companies you own/follow. We can adjust the peers to be any universe of your choosing (e.g., your benchmark, S&P 500, specific coverage universe, or even your own portfolio).
Buybacks – Hoovering Up Free Cash Flow
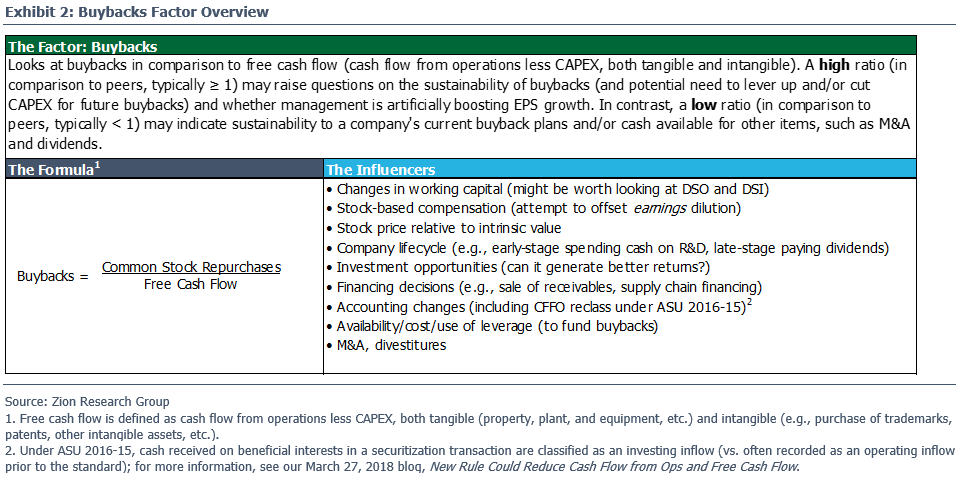
Our buybacks factor simply looks at what portion of a company’s free cash flow it is using on stock buybacks. The more it uses, the less sustainable the buyback (all else equal) and vice versa. See Exhibit 2 for additional information.
S&P 500 (ex-Financials) Spent More than Half of Free Cash Flow Over Ten Years on Buybacks
We dug a bit deeper into our buybacks factor to see how much of free cash flow (as defined by Compustat) the S&P 500 companies (ex-Financials) spent on buybacks over the past ten years. Here are a few takeaways:
- The nearly $3.9 trillion spent on buybacks by the S&P 500 companies (ex-Financials) over the past ten years, used 52% of aggregate free cash flow.
- The median S&P 500 company spent 43% of free cash flow on buybacks.
- 175 companies spent more than half of their free cash flow on buybacks during the past decade. Consumer Discretionary and the Tech sector standout with 40 and 35 companies, respectively.
- 67 companies spent more on buybacks than total free cash flow generated (27 of those companies had negative free cash flow for the ten-year period).
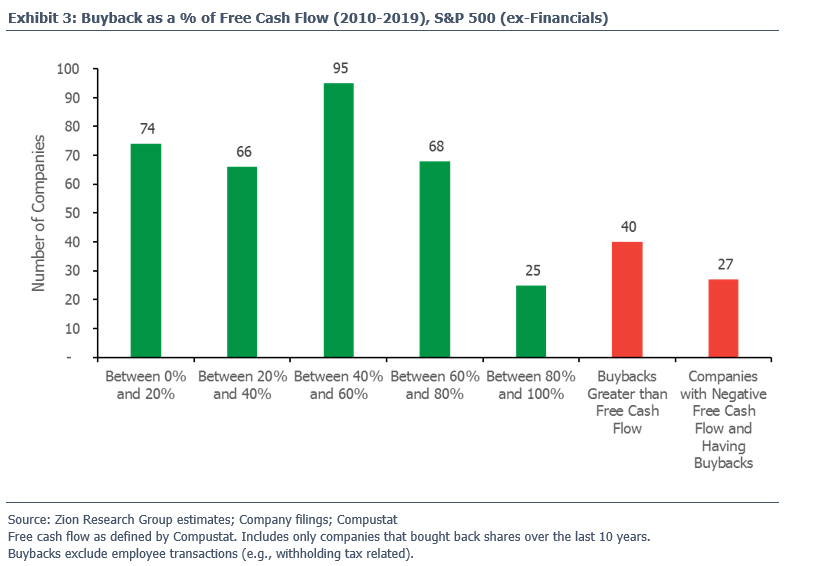
There was a $391 billion gap between free cash flow and buybacks for the 67 companies that spent more on buybacks than the free cash flow they generated. That gap was more than $5 billion for 23 companies.
Buy-High, Sell-Low?
So, what does the data tell us? In Exhibit 4, you can see aggregate buybacks for the S&P 500 by month for thirteen years starting in 2007. Note how buybacks tend to rise and fall with stock prices. For example, the S&P 500 companies spent $261 billion buying their own shares in 2010 when the index was below 1,250 for most of the year. Then in 2018 and 2019, with the index well above 2,500 the companies spent $779 billion and $663 billion, respectively.
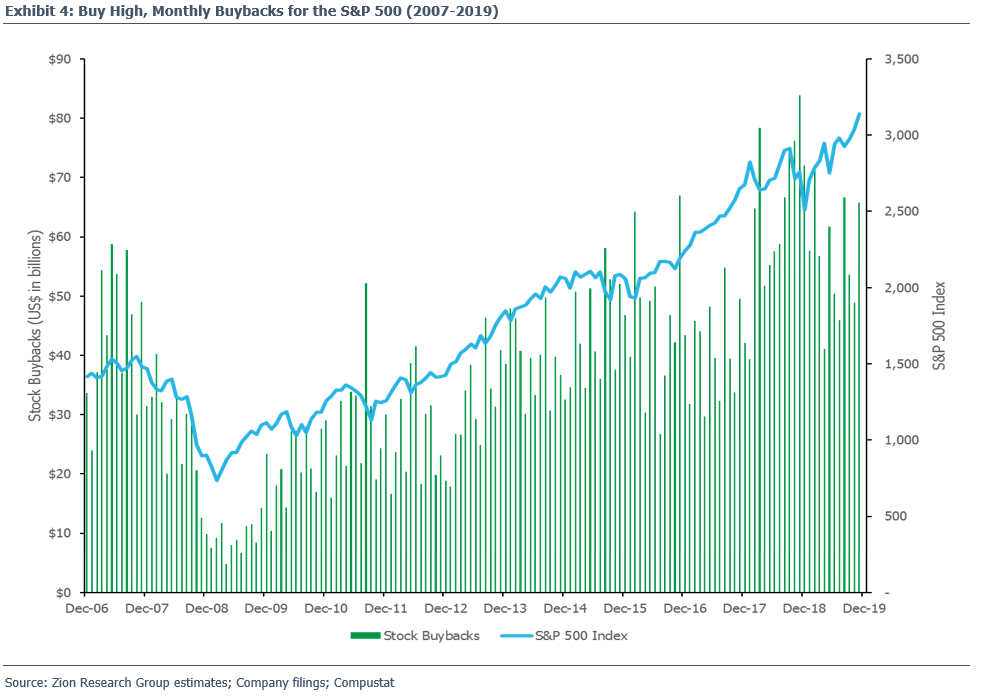
But buying high is the exact opposite of what corporate finance theory and common sense would tell you (buy-low, sell-high). So, why do companies do it? Stock-based compensation is a key driver. Companies buy back more and more stock as stock prices rise to try and offset the increasing earnings dilution from stock-comp to help boost EPS growth to meet/beat consensus estimates (and in some cases hit incentive comp targets). Of course, those buybacks don’t have any impact on the economic dilution that still takes place (unless the repurchases were done on the same date the shares/options were granted).
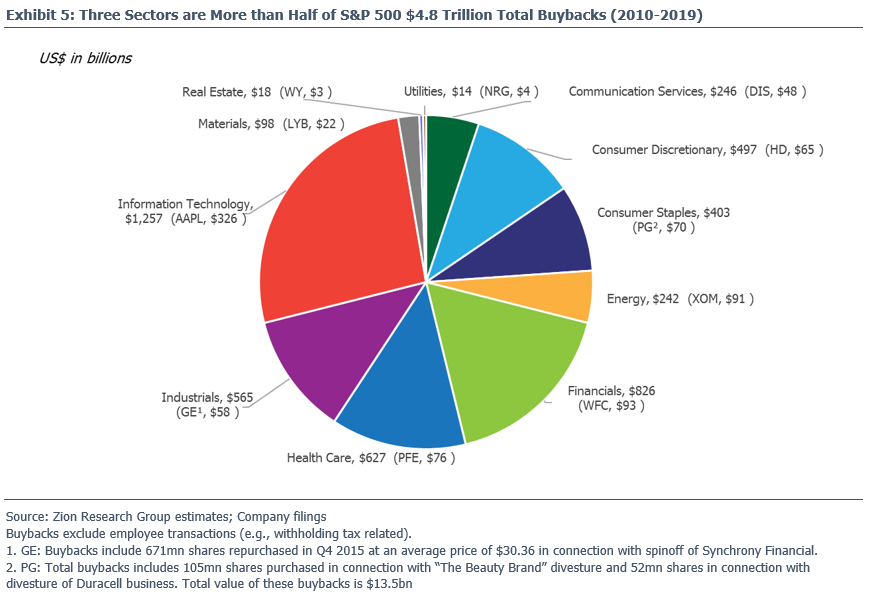
$4.8 Trillion in Buybacks Over Ten Years Are Concentrated
You can see in Exhibit 5 that the spending on buybacks varies quite a bit by sector. Just three sectors, Information Technology, Financials and Health Care, account for nearly 56% of the close to $4.8 trillion in total buybacks for the S&P 500 over the past ten years. We also show the company with the biggest buybacks by sector. Four of those, Exxon Mobil, NRG Energy, Apple and LyondellBasell Industries had more than 20% of their sector’s total buybacks.
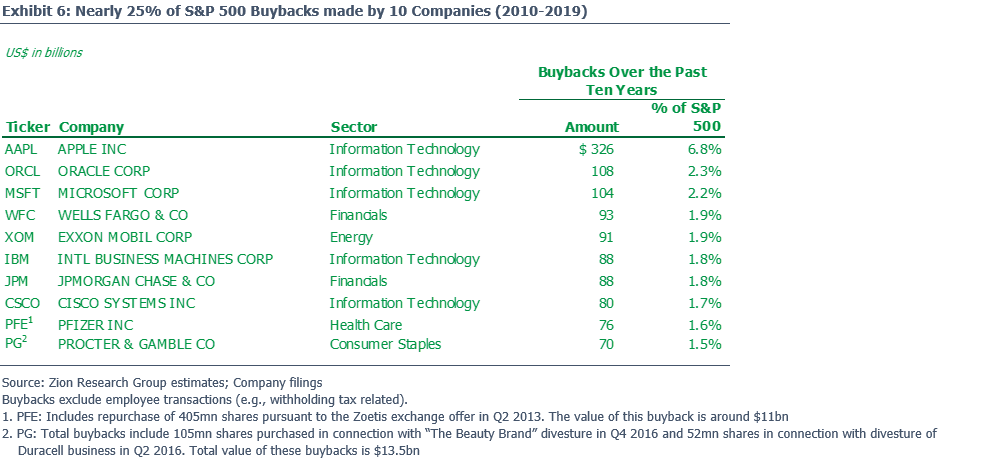
 We continue to see the concentration in buybacks at the company level, with 50 companies accounting for over half the S&P 500 total, including the ten companies in Exhibit 6 that make up more than 23% of total buybacks.
Keep an eye out for more from us on buybacks. We expect to follow up with analysis on whether buybacks are adding or destroying value and what impact they’ve had on EPS growth (keep in mind even if they boost EPS buybacks can destroy value for the remaining shareholders).
You are super busy, especially with earnings season fast approaching! Let us take stuff off your plate. How can we help you?
Take care and stay safe,
Dave
PS: During these difficult times we could all use a smile, give a listen to Lovely Day by the late Bill Withers.