Non-GAAP is Wack? #4: Adjusted EBITDA Vapors
Can you feel it, nothing can save ya
For this is the season of catching the vapors - Biz Markie
It was the 1980’s: Madonna and The Simpsons made their debut, you wanted your MTV, and there was the Miracle on Ice. Over on Wall Street, cable/media mogul John Malone popularized a new, non-GAAP metric viewed as a proxy for pretax cash flow and the ability of a company to service its debt: Earnings Before Interest, Taxes, Depreciation and Amortization or EBITDA. Unlike New Coke (RIP 2002), EBITDA remains with us today, though in some cases mutating to something widely different than the original metric.
In the fourth (and soon to be released fifth) edition of our Non-GAAP is Wack? series, we’re focusing on Adjusted EBITDA for a select group of names, slicing/dicing the data, offering commentary on a few of the adjustments as well as giving our two cents on the metric. Without further ado, let’s begin.
What’s the Purpose of Adjusted EBITDA?
EBITDA seems to be everywhere we look despite the continual debate around its usefulness (e.g., EBITDA doesn’t take into account the capital intensity of a business or changes in working capital or the fact that it must pay taxes to name a few pitfalls). Here’s a simple exercise for you to try: the next time you use an EBITDA-based valuation, ask yourself if it’s the appropriate metric to use for the company you are valuing. For example, if the company requires a significant amount of investment to grow, maybe EBITDA is not the best metric to use.
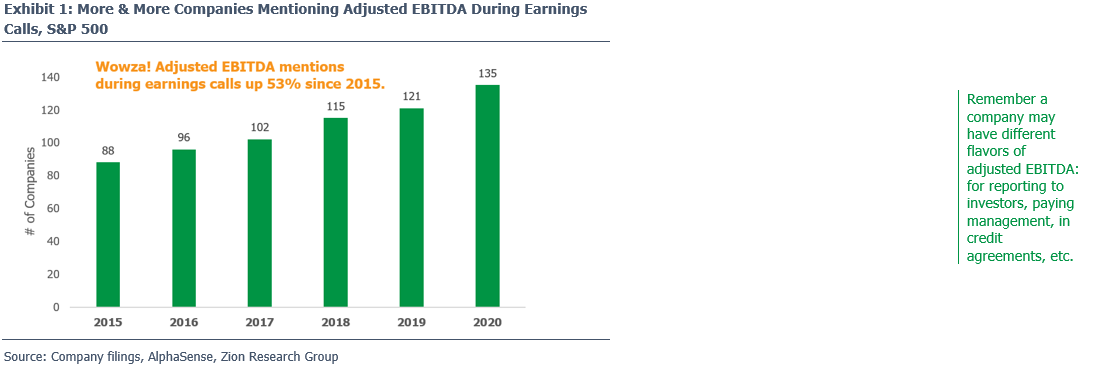
As if there weren’t enough concerns around traditional EBITDA (remember it’s not defined by GAAP), management teams have decided to adjust it even further. You can see in Exhibit 1 that mentions of adjusted EBITDA during earnings calls has increased 53% since 2015 (for the S&P 500).
As to why management believes the metric is useful to investors (a required SEC disclosure per Regulation S-K) the reasons aren’t always crystal clear. For example, take Airbnb’s (ABNB) explanation for adjusted EBITDA’s usefulness in its recent S-1 in Exhibit 2.
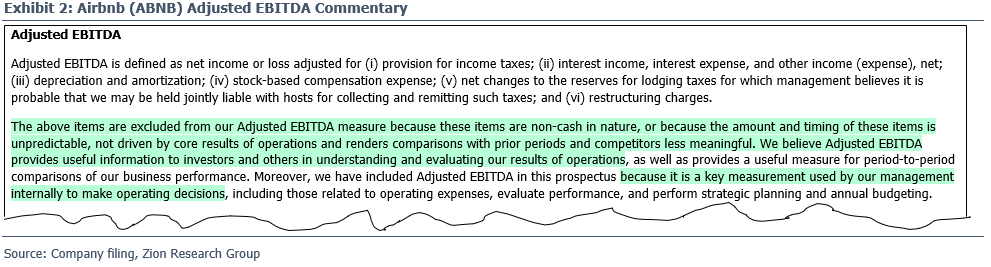
We’re curious as to how management “makes operating decisions” based on a metric that ignores the stock-based compensation used to pay and retain employees. Also, why adjust for the change in reserves for lodging taxes: it’s probable (~70% or greater chance of occurring in accounting speak) Airbnb “may be jointly liable” for paying the tax and is adjusted for all five years of results presented (i.e., it’s a cash outflow that’s recurring in nature). Also, if half of Airbnb’s revenue is denominated in foreign currency, should investors really ignore the FX gains/losses buried in the other income/expense adjustment? Now is a great time to insert a shameless plug for our recent FX piece, Red Flag Finder #5: The FX Mess – Explained.
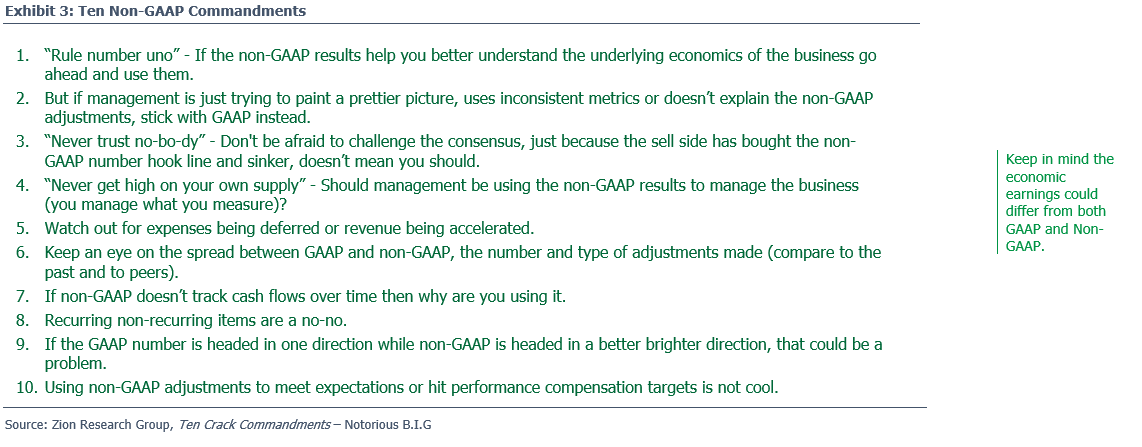
Regardless of how management justifies its use of non-GAAP results, it’s important to not just accept every adjustment thrown at you. Instead, we recommend following our Ten Non-GAAP Commandments in Exhibit 3.
Where to Start?
When trying to analyze adjusted EBITDA reported to investors, we had to first ask ourselves two questions: which companies to analyze and which metric to compare to adjusted EBITDA?
Regarding the first question, we turned to Goldman Sachs’ “Hedge Fund VIP Index” (GSVIP), a list of 50 companies that appear most frequently among hedge funds’ top 10 long equity holdings (for more information on the index, click here). While not perfect, we view this as an index that may include names that investors (including possibly yourself) care about and likely report a few non-GAAP metrics that we can offer our two cents on. Within the index (as of June 30, 2020), 15 names across a range of sectors reported adjusted EBITDA, which we will collectively call, the “EBITDA Stars”.
 As for what to compare adjusted EBITDA to, there are multiple potential answers: operating cash flow or maybe operating income or what about net income? Of our 15 EBITDA stars, 12 started their non-GAAP reconciliation with GAAP net income or net income to common shareholders (to recall, the SEC requires companies to reconcile non-GAAP metrics to the closest GAAP metric). The remaining three, Crown Holdings (CCK), Equinix (EQIX) and Sea Limited (SE) started with operating income, which isn’t defined by GAAP and may go against SEC non-GAAP guidance. Per the SEC’s Compliance & Disclosure Interpretations ("C&DI’s"), EBITDA (which we assume extends to adjusted EBITDA as well) should be reconciled to net income as EBITDA includes adjustments “that are not included in operating income” (e.g., interest and taxes).
 In the end, we decided to compare adjusted EBITDA to EBITDA to fully isolate additional adjustments made beyond those for ITDA, such as stock-based compensation and M&A related charges. As far as calculating EBITDA, we arguably took a purist approach: GAAP net income + interest expense/(income) + income tax expense/(benefit) + depreciation & amortization. As a quick note, the data is based on the 8-K filed (6-K for foreign filers) for the specified time period (e.g., FY 2016 non-GAAP data is from FY 2016 8-K); we made an exception with our recent IPO darlings (CHNG and UBER), pulling prior year data from their S-1’s in order to get a longer track record.
By starting with GAAP net income, we are taking a bottoms-up path to calculating EBITDA. As discussed in our piece, Non-GAAP is Wack? EBITDA Depends Upon the Path You Take, there are multiple ways to calculate EBITDA (a non-GAAP metric), which in turn leads to differences in the EBITDA vs. adjusted EBITDA spread. For example, if we started our EBITDA calculation with operating income (adding back depreciation and amortization), we’d ignore companies’ non-operating adjustments, such as those made for other income and goodwill impairments, likely resulting in a lower EBITDA vs. adjusted EBITDA spread than if we started at net income.
Are We Approaching Peak Adjusted EBITDA?
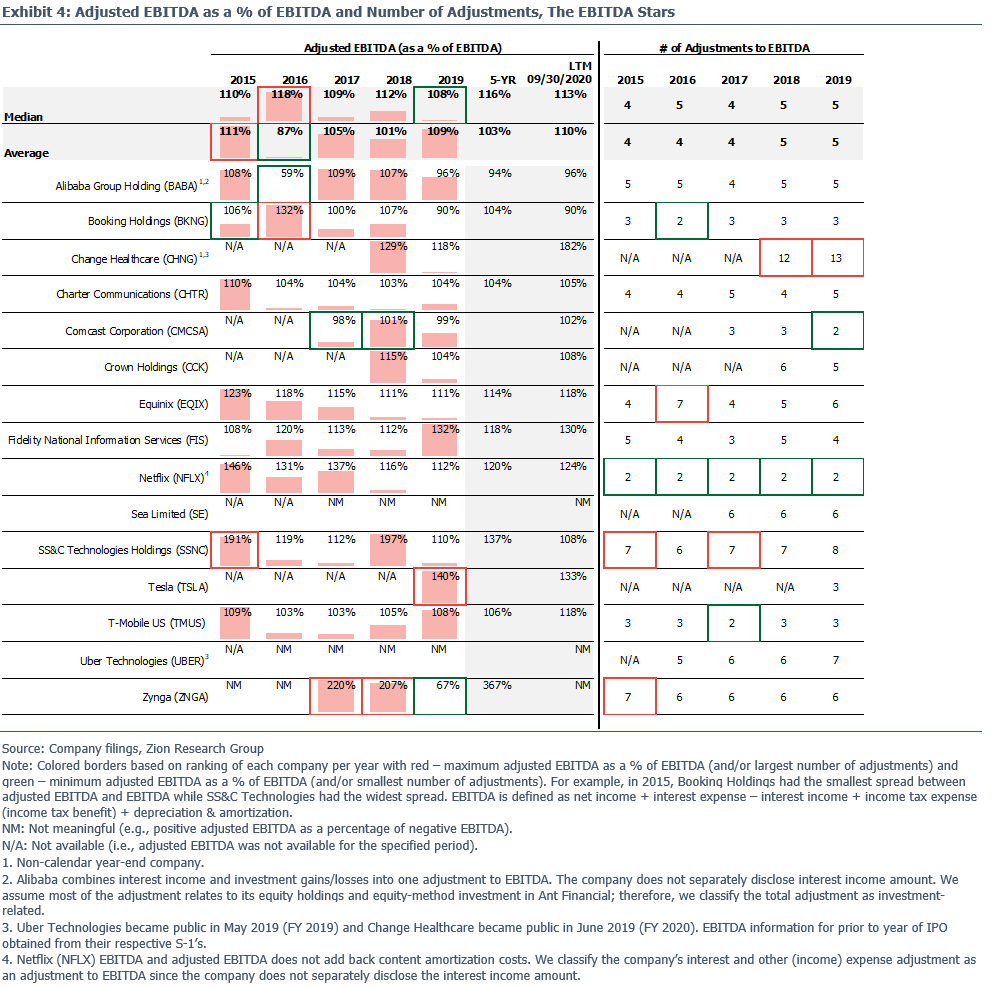
 Based on Exhibit 4, it seems like we’re getting close. Notice that on a weighted average basis, adjusted EBITDA is running at 110% of EBITDA over the last 12 months; that’s the highest level since 2015 and the median of 113% is the second highest over the past five years. Keep in mind our median and weighted averages are being swayed by the “Alibaba effect”, which we discuss later.
 Looking at the data, there appears to be no clear link between the number of adjustments and EBITDA vs. adjusted EBITDA spread (e.g., an impairment can increase the spread significantly and counts as just one adjustment). The average number of adjustments slightly increased starting in 2018, likely due in part to the recent addition of Change Healthcare (CHNG) which had 12 and 13 adjustments to EBITDA for 2018 and 2019, respectively (wowza).
Got 99 Adjustments…
 Ok, so what adjustments do companies make to arrive at adjusted EBITDA? Provided in Exhibit 5 are 99 different company-labeled adjustments made by the EBITDA Stars which we then grouped into seven categories. Adjustments in red resulted in a lower adjusted EBITDA (not many of those) while adjustments in green resulted in a higher adjusted EBITDA.
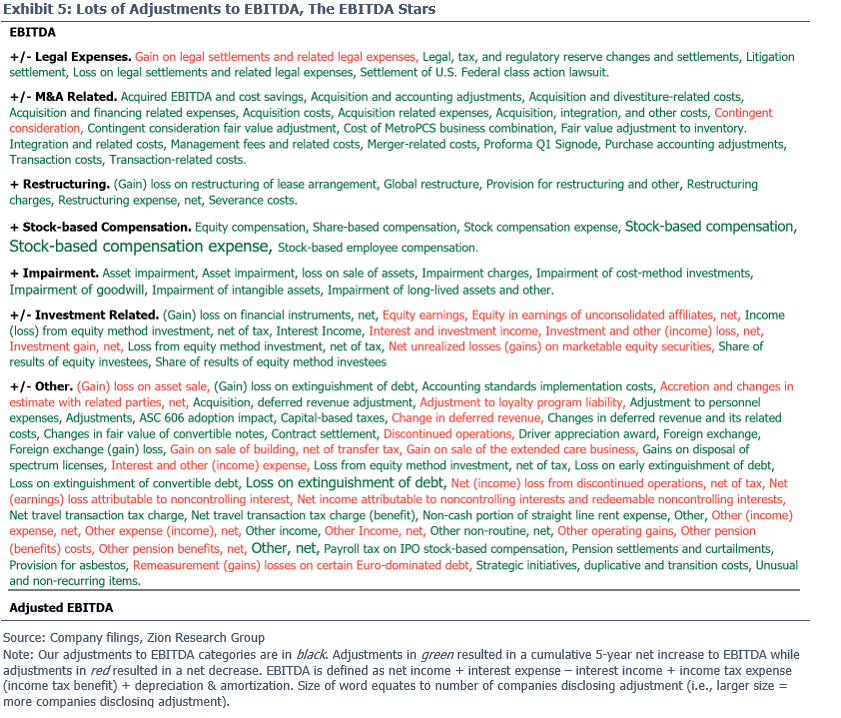
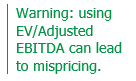 Dealing with non-GAAP data can be painful for various reasons, including the most basic problem: it’s difficult to aggregate and compare across companies (we can help you). Much of that is the result of companies making different adjustments and using varying descriptions for the adjustments they make, which you can plainly see in Exhibit 5. You’re never really sure if you’re comparing apples to apples or potayto to potahto or persimmon to watermelon. As a result, be very careful when using EV/Adjusted EBITDA valuation metrics. For example, that stock might look relatively cheap because the management team makes different adjustments than its peers or it might look cheap versus the past because it has added more add-backs to arrive at today’s version of adjusted EBITDA.
 A few things to note. Specifically, 73 (74%) of the company-defined adjustments resulted in a cumulative net increase to EBITDA over the past five years while 26 (26%) resulted in a decrease to EBITDA, 18 of which are in our “other” category. On a dollar basis, the numbers are even more staggering; of the $10 billion in total adjustments made, $46.2 billion were add-backs increasing EBITDA (by 14%) while $36.2 billion were reductions lowering EBITDA (by 11%).
Now’s about time when we discuss the “Alibaba effect”. Around 62% or $22.3 billion of the $36.2 billion worth of negative adjustments over the past five years come from Alibaba’s “interest and investment income” adjustments (note: the company doesn’t separately disclose interest income). We assume most of these adjustments relate to gains from its $58.7 billion investment portfolio (as of 09/30/20, similar to GM’s market cap). Removing Alibaba from our analysis essentially doubles the five-year cumulative Non-GAAP vs. GAAP EBITDA spread from 3% to 6%.
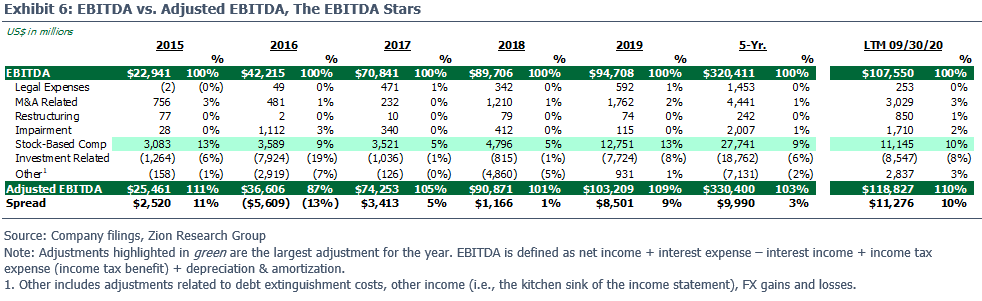
What’s Driving the Spread Between EBITDA and Adjusted EBITDA?
 We group all of those adjustments into a manageable number of categories in Exhibit 6. Perhaps coming as no surprise, stock-based compensation is the largest adjustment over the past five years, boosting cumulative EBITDA by 9%. Beyond that, M&A related charges have typically added 1-3% to annual EBITDA, followed by chunky adjustments for impairments (…cue Booking’s $941 million impairment on its $2.6 billion acquisition of OpenTable in 2016, guess the service was mediocre).
On the opposite end of the spectrum, investment related adjustments (e.g., gains from equity holdings) reduced annual EBITDA by 1-19%; guess this goes to show the volatility in the stock market and valuing illiquid assets. Investors could take a less purist approach and include such adjustments in their definition of EBITDA as this income/loss comes from nonoperating assets, such as equity holdings in other companies, which are often excluded from a company’s enterprise value.
Regarding stock-based compensation adjustments, we always got a bone to pick. We’ll be back soon with a closer look at this adjustment, including a discussion on our hybrid-approach that adjusts management’s stock-based compensation adjustment to take into account buybacks.
The Unusual Matters
Regarding non-GAAP inconsistencies (e.g., a company being inconsistent with its adjustments YoY), we didn’t find much evidence among the EBITDA Stars. So, we decided to do a quick search of “EBITDA” within their SEC comment letters over the past two years and found two notable mentions, both of which relate to the S1’s of newly public companies, Uber Technologies (UBER) and Change Healthcare (CHNG).
Uber was called out for labeling its “legal, tax, and regulatory reserves and settlements” non-GAAP adjustment as “non-routine” when the adjustment was made annually for the past three years, notably decreasing its negative EBITDA in 2017 by ~11%. We’re not sure why the SEC didn’t take it a step further by calling them out for the overall legitimacy of the adjustment; one could make the case that it’s a part of operations when its consistently occurred over the past three years and described by management as a charge that “may reduce cash available to us” (i.e., it’s a cash charge).
For Change Healthcare, the SEC called out the company for reconciling adjusted EBITDA to adjusted net income, in other words, reconciling a non-GAAP metric to another non-GAAP metric. As we noted in the Appendix of our Non-GAAP is Wack? #2: Finding Accounting Glitches in Software report, companies must reconcile non-GAAP metrics to the most directly comparable GAAP metric. Whoopsies.
SS&C Technologies (SSNC), the Lost Revenue Finder
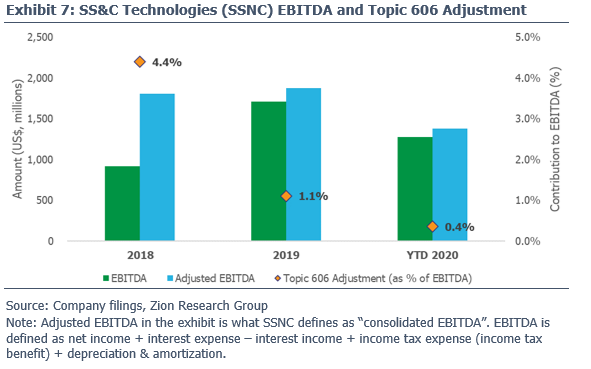
We’re going to wrap things up with an example of one company whose adjusted EBITDA caught our eye: SS&C Technologies (SSNC), a financial technology company. The company on average has made seven adjustments to EBITDA, leading to a 37% cumulative spread between EBITDA and adjusted EBITDA over the past five years.
In Q1 2018, the company adopted the new revenue recognition standard, Revenue from Contracts with Customers (Topic 606) and reported a new EBITDA adjustment, “ASC 606 impact”, which relates to revenue “that would have been recognized if not for adjustments to deferred revenue and retained earnings related to the adoption of ASC 606”. Looking at Exhibit 9, the impact was most notable in 2018 with a 4.4% boost in 2018, tapering down to a 0.4% boost to YTD 2020 EBITDA.
Many of you may be wondering, what is the purpose of this adjustment? Great question! SSNC is adjusting EBITDA for “lost” revenue, which happens when previously deferred revenue under Old GAAP/ASC 605 gets recognized under Topic 606 prior to the transition date (January 1, 2018 for SSNC) and therefore is not recognized as revenue in the future (i.e., after January 1, 2018).
In other words, the deferred revenue (sitting on the balance sheet prior to Topic 606 adoption date) that investors were counting on to be recognized as revenue over the next few years (around $60 million per management) disappeared into retained earnings. For more information on lost revenue and all things Topic 606, see our report, Top Lines They Are A-Changin’ What Companies are Sayin’ About Topic 606.
We have two primary concerns with this adjustment. First, as we noted in our blog, Accountingfest 2018, adjusting for the impact of Topic 606 after the initial year of adoption (FY 2018 for SSNC) would likely be deemed by the SEC as an “individually tailored revenue recognition and measurement method”, a non-GAAP no-no. SSNC continues to adjust for Topic 606’s impact more than two years after adoption. By combining Topic 606 revenue from current transactions with revenue that would have been recognized from Old GAAP, SSNC’s adjusted EBITDA is a rev rec monster from two different accounting worlds.
Second, we’re not sure this adjustment better reflects the underlying economics of the transaction. The impact from Topic 606 primarily relates to the sale of term licenses: prior to Topic 606, SSNC lacked vendor-specific objective evidence or “VSOE” of fair value for the maintenance component of term licenses, resulting in ratable revenue recognition for the term license and related maintenance over the term period (one to seven years).
Under Topic 606, the VSOE requirement is removed, resulting in upfront recognition of the license component and ratable recognition of the maintenance revenue. If the customer can use the license after purchasing (think Microsoft Office) and the only remaining obligation for SSNC is providing maintenance (recognized separately on a ratable basis), shouldn’t the license revenue be recognized upfront?
Non-GAAP Ain’t Going Nowhere, Nor are We
Non-GAAP is like a weed that continues to grow and grow, showing up across sectors, in earnings calls/releases, proxies, credit agreements and coming in a wide variety of different flavors (when did adjusted free cash flow become a thing?) with no clear end in sight. We’ll be back soon with another edition to our Non-GAAP is Wack? series specifically focused on the stock-based compensation adjustments for the EBITDA Stars.
In the meantime, do you need help digging deeper on the non-GAAP metrics of the companies you own/follow? Do the adjustments make sense? What’s the quality of their adjusted EBITDA, etc.? If so, we’re just a short email/phone call away. Need some ideas in the kitchen (getting tired of Taco Tuesday)? We’re also flexing our cooking/baking skills on our Instagram page (recipes included).
And finally, we owe a big shout-out to our Binghamton University externs that helped with the immense non-GAAP data gathering process. Thank you, Andrew O., Andrew S., Derek, Tanner and Xue Lin.
May the force be with you,
Ben