Big Beautiful Budget Bill: Back of the Envelope FCF Boost #2
Fitted like pieces of puzzles, complicated - Eric B. & Rakim, Microphone Fiend
As you know, on July 4th, with much fanfare (including a B-2 bomber flyover), President Trump signed into law the One Big Beautiful Bill Act (OBBA), and it’s $12.5 trillion in tax provisions (it sure is big!). The big-ticket stuff in the new law make permanent a number of items from the Tax Cuts and Jobs Act (TCJA) that were set to expire, like lower tax rates on individuals and the big (fourth use of the word “big” in two sentences) three for corporates: 100% bonus depreciation, upfront R&D expensing and relaxing the limit on tax deductibility of interest expense.
With earnings season about to pick up pace (and the British Open teeing off today) we’re expecting companies to get questions on the potential impact of the OBBA, don’t be surprised if most say they’re still evaluating the new law and are hesitant to update their cash flow guidance (though that could change with third quarter earnings). To give you a head start, we’re releasing the fifth piece in our big, beautiful series, where we refine our back of the envelope estimates of the impact of the tax changes on free cash flow (FCF).
The new law includes a number of corporate tax-related changes, but for the purpose of this piece we are focusing on the following big three, all of which have been made permanent:
- 100% Bonus Depreciation for most depreciable assets in the U.S. acquired and placed in service after January 19, 2025 (see Big Beautiful Budget Bill: 100% Bonus Depreciation). Full expensing of capex would also be temporarily expanded to include the cost of “qualified production property” meeting several criteria. Think non-residential real property (e.g., a factory building) used to manufacture, produce, or refine a tangible product.
- Upfront R&D Expensing, companies can once again choose to expense U.S. R&D costs upfront for tax purposes (foreign R&D will continue to be amortized over 15 years), starting with costs incurred during tax years beginning after December 31, 2024 (see Big Beautiful Budget Bill: Upfront R&D Expensing). In addition, companies could choose to accelerate the amortization of any unamortized U.S. R&D costs incurred between 2022-2024 over a one- or two-year period.
- Relax the limit on tax deductibility of interest expense back to 30% of EBITDA (which was used from 2018-2021, instead of EBIT which is used today) for tax years beginning after December 31, 2024 (see Big Beautiful Budget Bill: Going Back to EBITDA for Interest Expense).
Timing of Initial Boost to Cash Flow Will Vary
Allowing companies to deduct more depreciation, R&D, and interest expense upfront on the tax return, reduces taxable income, resulting in lower cash taxes and an initial boost to cash flow (though the timing is a bit difficult to nail down). We’d expect calendar year companies to start feeling that cash flow boost in the third quarter through lower estimated tax payments due on September 15th and then again in the fourth quarter (estimated taxes are due on December 15th). The remainder of that initial boost to cash flow (if any) should come in the first two quarters of 2026 (assuming companies apply for and receive a quick refund of any overpayment of estimated taxes in the first quarter and file their tax return in the second quarter).
 Things get a bit trickier for companies that have a fiscal year-end for tax purposes. For example, a company with a July year-end, could claim 100% bonus depreciation (for eligible capex after January 19, 2025) on its fiscal 2025 tax return, but would not see any cash flow boost until fiscal 2026. When it comes to R&D and interest expense, all fiscal year companies must wait until FY26 as both don’t go into effect until tax years beginning after December 31, 2024.
New Level of Cash Flow May Not Be Sustainable
However, that level of cash flow may not be sustainable, especially for those companies where the boost from lower cash taxes is mainly driven by accelerating the amortization of any unamortized R&D and the usage of interest expense-related carryforwards (think of these as one-time gifts from Uncle Sam to Corporate America). In fact, those companies could eventually be facing a YoY tax-related drag on cash flow, depending upon the timing of when taxes are actually paid.
 In addition, by lowering the after-tax cost of capex, R&D and debt, the new rules are meant to spur additional investment by Corporate America. If they are successful and companies spend more on capex and R&D (we’re skeptical as the size of the economic savings on a present value basis, pointed out in past pieces, seem unlikely to significantly change behavior) that would result in a free cash flow drag (all else equal). Of course, companies could just take the cash tax savings and put it to some other use, like buying back their own stock.
Also keep in mind that there’s no impact on GAAP expenses, book taxes (unless there’s a change in deferred tax valuation allowance) or earnings. As a result, you can expect to see improved cash conversion (all else equal).
Back of the Envelope Impact on Free Cash Flow
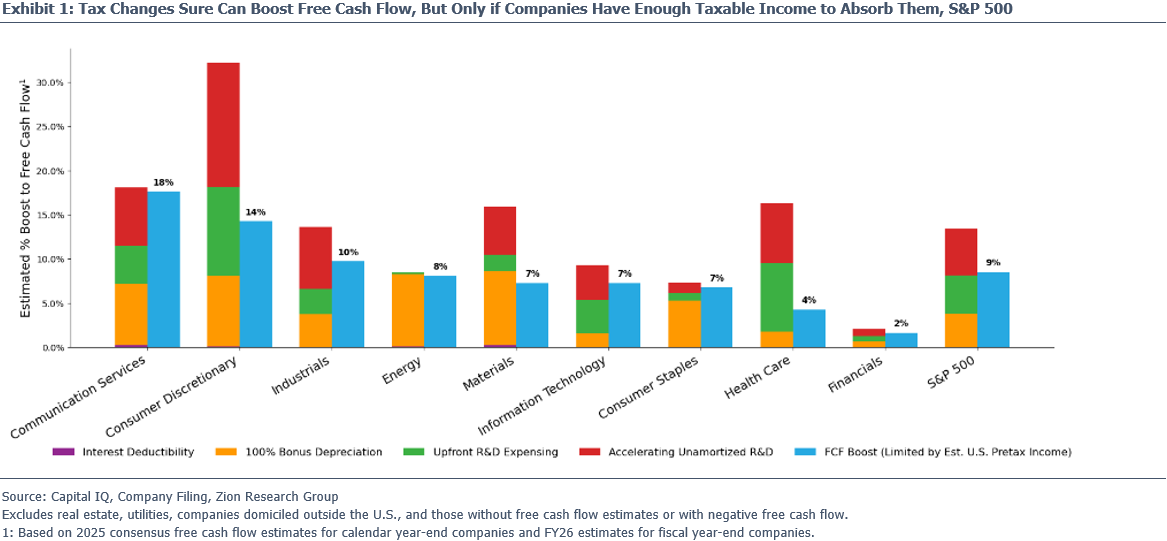
 Ok, how much of a boost to corporate cash flow are we talking about? After making some refinements to our back of the envelope approach (see below), we now estimate that the combination of 100% bonus depreciation, upfront expensing of R&D and allowing more interest expense to be deductible on the tax return would boost free cash flow for the S&P 500 by $148 billion, that’s 8.5% of consensus estimates (as contrasted with our initial estimates of $227 billion and 14% respectively).
In Exhibit 1 you can see that three sectors stand out, Consumer Discretionary, Health Care and Materials, where our initial back of the envelope estimate of the boost to FCF drops off significantly when we factor in estimates of U.S. taxable income (to limit the amount of additional deductions the companies would be able to claim on their tax return). Signaling that the companies in these sectors may not have enough in profits to benefit immediately from the tax changes. If so, that would result in an increase in NOL carryforwards unless they can find a way to generate more taxable profits in the U.S. (e.g., manufacturing fewer drugs in Ireland and more in the U.S.).
 The other thing to keep an eye on in Exhibit 1 is which of the tax changes are driving the bump in free cash flow, as they are not all created equal. For example, for the S&P 500 about 39% of the impact is a result of the accelerated amortization of R&D (the red zone in Exhibit 1), this is a lower quality source of cash as it is not sustainable which you should factor into your model accordingly (if you need some help with that, we can run our One Big Beautiful Model, which combines bonus depreciation, R&D and interest expensing under one roof for the names you care about).
Different View at the Company Level
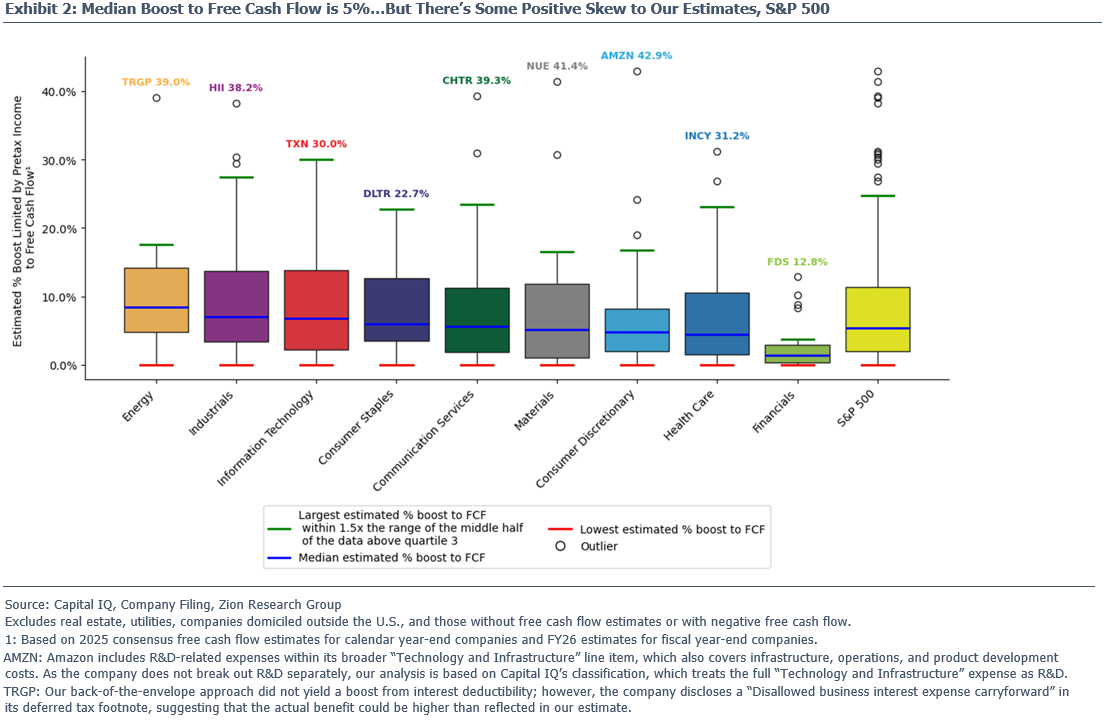
 When we drill down to individual companies, we estimate the median boost to free cash flow from the big three tax changes is 5% (our initial estimate was 9%), with 109 companies seeing a more than 10% boost including 13 where free cash flow could jump by more than 25% (seven of those show up amongst the outliers that we highlight in Exhibit 2). Don’t hesitate to reach out if you’d like to see the list of outliers, a particular sector, the entire S&P 500 or if you want us to apply our back of the envelope approach to your interest list.
 But remember this is just a back of the envelope estimate, a starting point, take one of the Consumer Discretionary outliers, Amazon.com, Inc. (AMZN) as an example. We’d expect the actual impact on their free cash flow to be less than our estimate (43% boost) as we’re probably giving them too much of a benefit from 100% bonus depreciation and R&D expensing. Since it is highly unlikely that all their U.S. capex will qualify and they don’t break out R&D separately. So, what should you do if you want to get a more finely tuned estimate? That’s easy, just ask us to run AMZN (or any other company) through our One Big Beautiful Model where we can better take into account a company’s specific facts and circumstances, run a variety of different scenarios and provide estimates beyond just one year.
Also notice how the results in Exhibit 2 differ from what we found in Exhibit 1, for example, when we look at the aggregate impact on the Consumer Discretionary sector it is near the top of the list in Exhibit 1 with a 14% boost to free cash flow. But at the company level in Exhibit 2, you can see that it has the third lowest median impact of 4.8%, signaling a handful of companies (e.g., AMZN) are skewing the results in the aggregate.
Back of the Envelope Methodology & Simplifying Assumptions
First off our analysis was limited to 369 companies in the S&P 500, as we excluded the 31 companies in the Real Estate sector, 31 companies in Utilities, 28 companies that are not domiciled in the U.S., 34 companies where there is no consensus estimate for free cash flow (no surprise most of those are Financials) and seven companies where the free cash flow estimate is negative.
For each company we estimated the boost to 2025 and FY26 free cash flow using the methodology that we laid out in the Big Beautiful Budget Bill: Back of the Envelope FCF Boost, with some refinements:
- We are no longer assuming that companies have enough taxable income to absorb all of the additional deductions on their tax return, instead we are using consensus estimates of pretax income to estimate U.S. taxable income that’s then used to place a limit on the amount of deductions that companies would be able to claim on their tax return and
- We are fine tuning the calculations for fiscal year end companies to factor in that for some only a portion of their 2025 capex is eligible for bonus depreciation (as discussed above) and that the R&D and interest expense changes don’t kick in until fiscal 2026.
We are also analyzing calendar and fiscal year companies a bit differently this time around. Since calendar year companies will be able to claim the full effect of the big three on their 2025 tax return, we estimate the potential 2025 tax savings and compare them to consensus 2025 free cash flow (even though as highlighted above, only a portion of that savings will likely show up in this year’s cash flow). But for fiscal year companies, the tax changes don’t fully kick in until their fiscal 2026, as a result we estimate the FY26 tax savings and compare them to FY26 free cash flow.
When using the back of an envelope you have to make a number of simplifying assumptions (there’s only so much space on those darn things), as a result our estimates could differ significantly from the actual impact of this stuff on cash flow, here’s a few worth bringing to your attention:
- We estimate U.S. taxable income based off consensus estimates of GAAP pretax income (remember that GAAP income often differs from taxable income on the tax return) and the FY24 proportion of U.S. pretax income as a % of the total. Which is then used to limit the amount of additional depreciation, R&D, and interest expense companies can claim on their tax return. If our estimate of U.S. taxable income is too high, we’re likely overstating the impact of the tax changes on FCF and vice versa.
- Using U.S. sales as a % of total sales to estimate U.S. capex and U.S. R&D could result in our estimates being too high or too low.
- Assuming that all U.S. capex is subject to bonus depreciation, should result in our estimates coming in higher than the actual impact on free cash flow.
- We start with reported R&D expense which could differ from R&D expense on the tax return (especially as it may include depreciation of R&D related equipment/buildings which would not be part of the R&D expense on the tax return). We start with the R&D deferred tax asset to estimate the amount of unamortized R&D costs, which could differ from what is available for tax purposes.
- We assume that companies choose to fully expense their R&D costs upfront and to amortize their unamortized R&D costs over one year.
- Using consensus EBIT and EBITDA which could differ from the “adjusted taxable income” that’s used on the tax return.
- We’re not factoring in that the usage of interest expense-related carryforwards could be accelerated, as a result the actual boost to cash flow could be higher than our estimates.
- We assume that the full impact for calendar year companies is felt in FY25 cash flows, however, that will likely not be the case for many companies based upon the timing of cash tax payments (as discussed above).
- For fiscal year companies we focus on FY26, but some fiscal year companies could see a cash flow benefit in FY25.
- We assume that companies use the same fiscal year end for tax purposes as they do for financial reporting.
- We do not consider the company’s other positive tax attributes, loss carryforwards, etc. which could alter how they think about things like choosing to accelerate the amortization of their unamortized R&D, etc.
Shameless Plug
Our suggestion is to use the back of the envelope estimates as a starting point, to help gauge the potential impact on the names you care about. From there, if you’re interested in fine tuning the analysis for specific names (to try and get in front of changes to company guidance, analyst estimate revisions, etc.), reach out to us and we can run our bespoke One Big Beautiful Model (the results can differ substantially from the back of the envelope estimates). Also, if you want to get a feel for the sustainable tax rate for a particular company (maybe their tax rate seems weirdly low), especially as changes are being made to the tax code and the threat of tariffs has companies rethinking where they make stuff, ask us about our Tax Rate Estimator.
Take care,
Dave